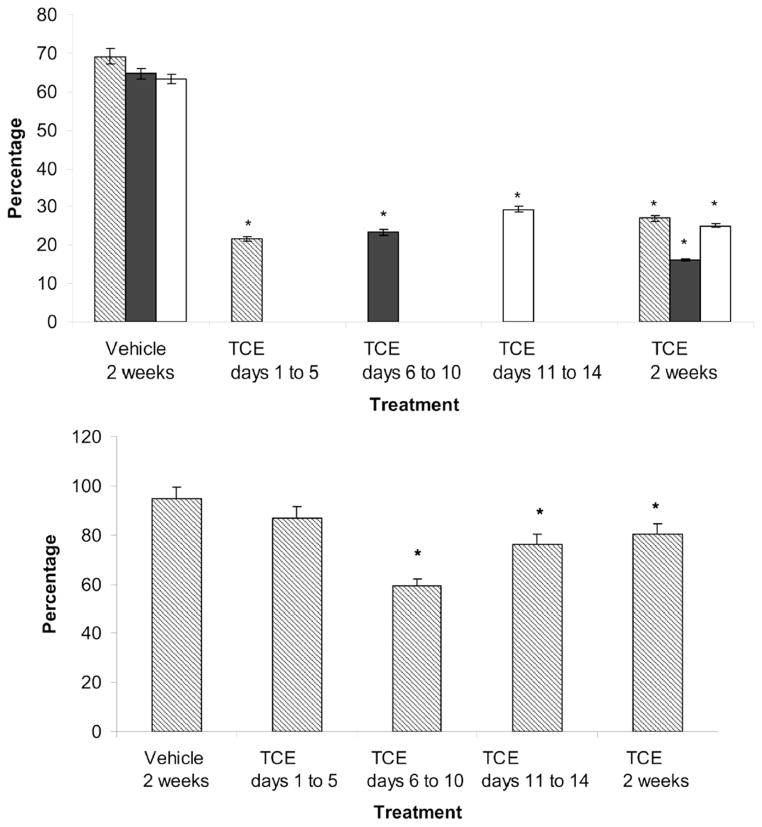
Figure 1.
(A) Decreased fertilizability of oocytes from TCE-exposed (0.45% TCE (v/v) in 3% Tween) rats compared with oocytes from vehicle-control (3% Tween) rats. Fertilization was assessed by the presence of decondensed sperm heads. Values represent the least squares means from three replicates. * indicates P < 0.05 compared with the vehicle control. (B) Oocytes with bound sperm. Bars represent the percentage of total oocytes (fertilized and unfertilized) that bound sperm. Oocytes from females treated with TCE on d 6 to 10, d 11 to 14 and for 2 wks bound fewer sperm compared with vehicle-controls. * indicates P < 0.05 compared with the vehicle control (Adapted from Wu and Berger, 2007 with copyright permission).

