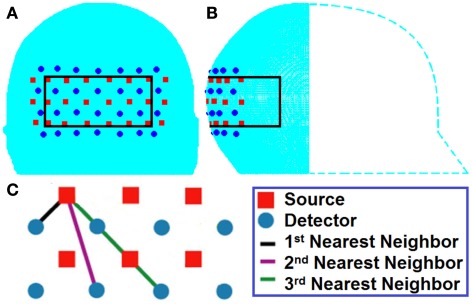
Figure 2.
(A) Posterior and (B) lateral schematic view showing the placement of the imaging array over the visual cortex of the head model with 24 sources (red squares) and 28 detectors (blue circles). A region of interest (ROI) was defined by the volume enclosed within the black solid rectangle, (C) first to third nearest neighbor measurements defined by separation of 13, 30, 40 mm respectively within the context of the HD imaging array.

