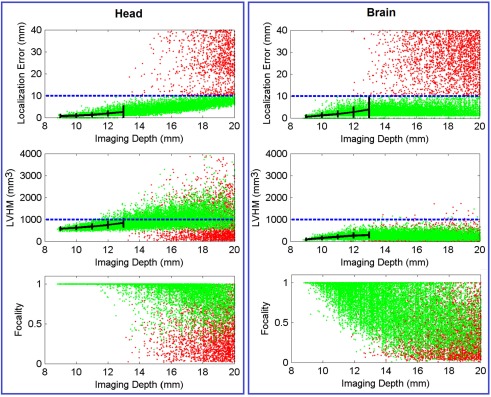
Figure 5.
Scatter plot of localization error, LVHM and focality versus imaging depth (up to 20 mm) for all PSFs reconstructed with full head [column (Head)] and brain constraint [column (Brain)]. Each dot, which represents a reconstructed PSF, is color-coded in green if its localization error is less than 10 mm or otherwise in red. The mean ± standard deviations are reported at 1.0 mm imaging depth interval (black solid plot) up to 13 mm. The blue dashed line in each figure represents tolerance level for each metric as stated in Section “Metrics of Image Quality.” In all cases the x-axis has been limited to 20 mm for conciseness.

