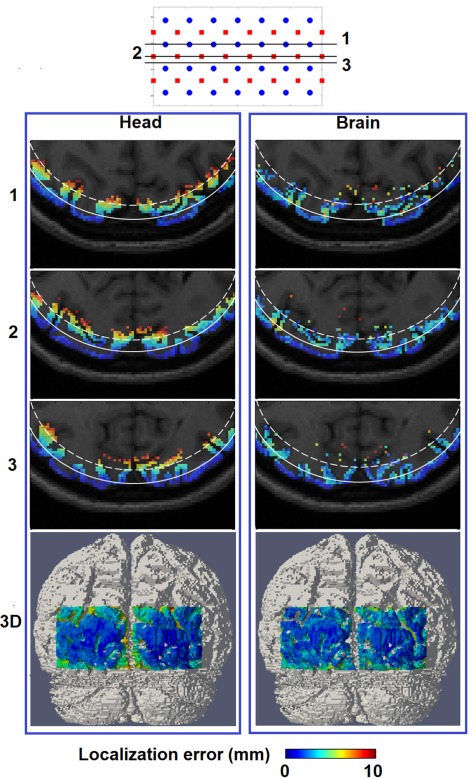
Figure 6.
Spatial distribution of localization error for image reconstruction with the full head [column (Head)] and a brain constraint [column (Brain)] are shown at three axial MRI slices (1, 2, and 3) with different positions relative to sources and detectors, as well as a posterior view on the 3D cortical surface (bottom row). The white solid contour on each MRI slices represents imaging depth of 13 mm below the scalp while the white dashed contour represents imaging depth of 18 mm below the scalp.

