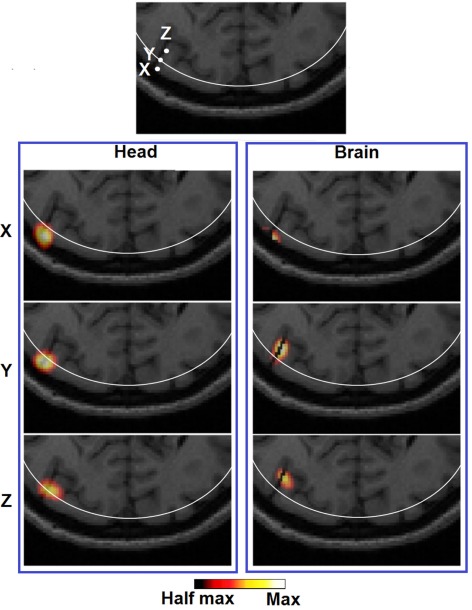
Figure 8.
Images of three target perturbations located along the same cortical fold but different depth: 10.22 mm (X), 13.14 mm (Y), and 18.13 mm (Z), and the corresponding PSFs shown at FVHM using full head [column (Head)] and brain constrained [column (Brain)] reconstruction. The white contour on each MRI slice represents the 13 mm imaging depth.

