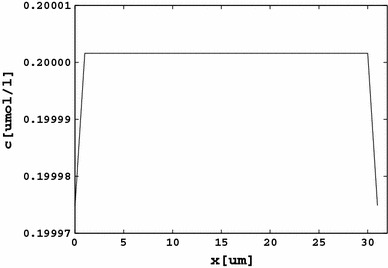
Fig. 4.

An example of the rest-state distribution of ions. The calcium distribution is shown. Due to the negative membrane voltage in the rest state, the regions close to the membrane walls are depleted of ions. Similar plots can be obtained for Na+ and K+
