Figure 6.
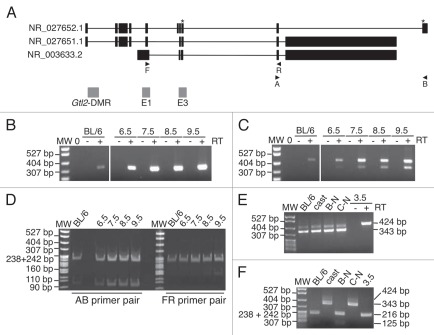
Expression analysis of Gtl2 in embryonic tissues. (A) Genomic structure of Gtl2, including exons (black boxes), B6 vs. CAST polymorphisms (*), major transcripts, primers used for RT-PCR and CpG-rich regions analyzed in this study (grey boxes). (B and C) RT-PCR of RNA from neonatal B6 liver and 6.5–9.5 d.p.c. B6 × CAST embryos using PCR primers A/B (B) and F/R (C). MW, molecular weight marker; 0, no template; + and − represent samples with and without reverse transcriptase (RT). (D) RT-PCR products from (B and C) were digested with SfcI and NgoMIV, respectively, to distinguish between products derived from maternal B6 vs. paternal CAST alleles. (E) RT-PCR of RNA from B6 brain, CAST brain and 3.5 d.p.c. B6 × CAST blastocysts using PCR primers F/R; B-N, C-N and 3.5 d.p.c. products were generated using a nested PCR approach described in the Materials and Methods. Alternative splice forms were detected in B6 and CAST samples; only the larger splice variant was detected in the +RT 3.5 d.p.c. sample. (F) RT-PCR products from E were digested with NgoMIV to distinguish between products derived from digested B6 vs. undigested CAST alleles.

