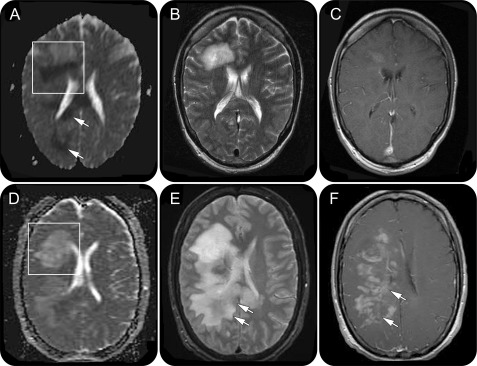
Figure 2. Evolution of apparent diffusion coefficient (ADC) pattern on prebiopsy serial MRI scans over a 12-day interval in a patient with CNS inflammatory demyelinating disease.
(A and D) Boxed region on the ADC map demonstrates the change in the ADC pattern of the index lesion from a dark arc (A) to a bright/isointense (D) pattern. In addition, arrows (A) indicate areas of restricted diffusion extending beyond the index/biopsied lesion on the initial MRI scan. (B and E) Regions of restricted diffusion observed in A are not initially associated with T2-weighted signal abnormalities (B) until the subsequent MRI (E, arrows). (C and F) Similarly, gadolinium enhancement develops in the previous areas of restricted diffusion, 12 days later (F, arrows).

