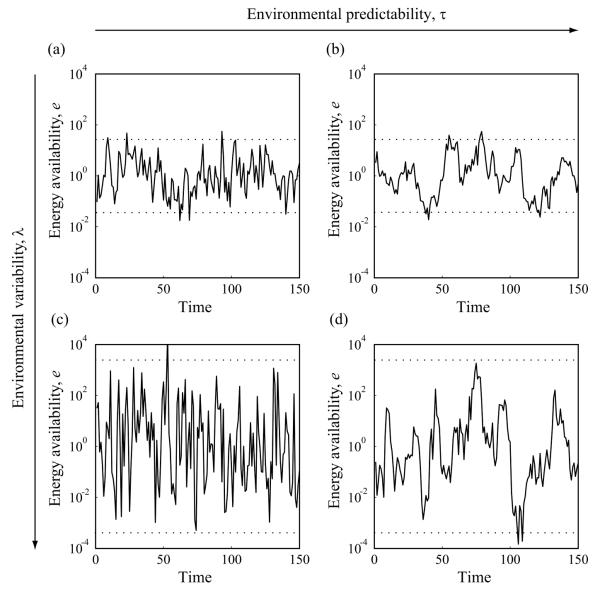
Figure 1.
Stochastic fluctuations in energy availability in four environments with different variability and predictability. The average amplitude of the time series increases with environmental variability λ, whereas its average frequency decreases with environmental predictability τ. Dotted lines show the resultant 95% confidence intervals for energy availability. Environmental variability λ is larger in the bottom row (c, d) than it is in the top row (a, b), while environmental predictability τ is larger in the right column (b, d) than it is in the left column (a, c): a, λ = 5, τ = 1; b, λ = 5, τ = 10; c, λ = 50, τ = 1; and d, λ = 50, τ = 10. Note that the vertical axes are scaled logarithmically.

