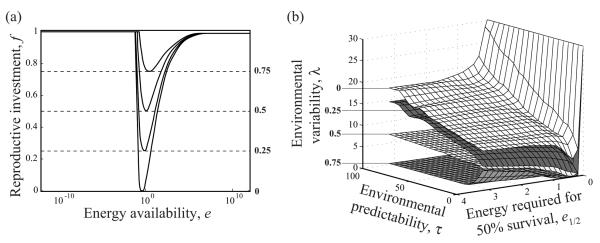
Figure 3.
Classification of evolutionarily optimal allocation reaction norms. a, Examples of reaction norms f(e) with minima at f = 0, 0.25, 0.5, or 0.75. b, Surfaces of parameter combinations (e1/2, τ, λ) resulting in optimal reaction norms with these minima. Plasticity thus increases from bottom to top.

