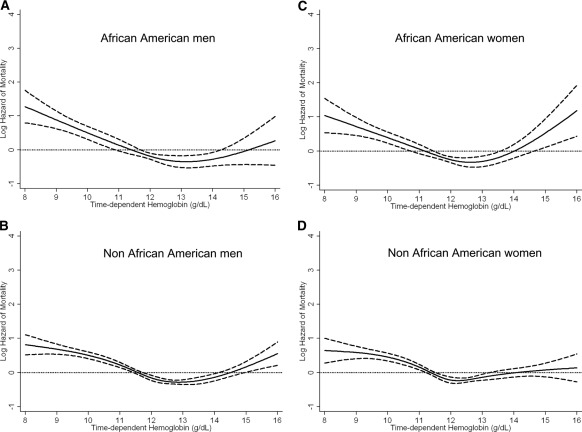
Figure 3.
Cubic spline and 95% confidence level of all-cause mortality for the entire range of hemoglobin across four subgroups based on gender and race (African-American men [A], non–African American men [B], African-American women [C], and non–African American women [D]) treated with peritoneal dialysis using a time-dependent analysis. Model adjusted for age, gender, race/ethnicity, pre-existing comorbid states, tobacco smoking, dialysis vintage, primary insurance, marital status, presence of diabetes, serum ferritin, iron saturation, weekly erythropoiesis-stimulating agent dose, body mass index, and eight laboratory surrogate variables for nutrition and inflammation.

