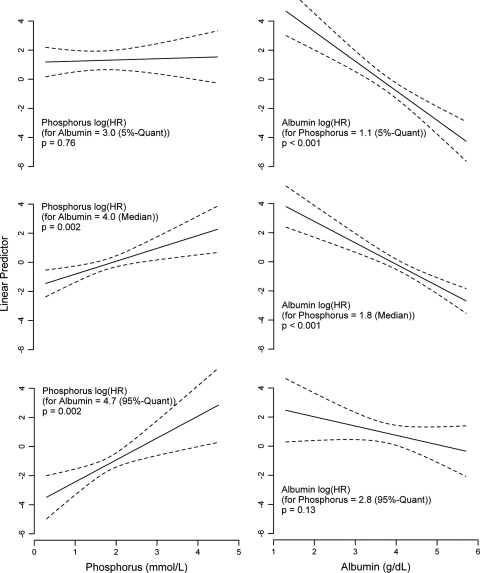
Figure 1.
Cox regression results for the extended adjustment model. The y-axis shows the log hazard ratios for varying values of phosphorus with their corresponding P-values, keeping the albumin values fixed at specific values (5%, 50%, and 95% quantiles [Quant]; left panels) as well as the log hazard ratios (HRs) with P-values for varying values of albumin, keeping the phosphorus values fixed at specific values (5%, 50%, and 95% quantiles; right panels).

