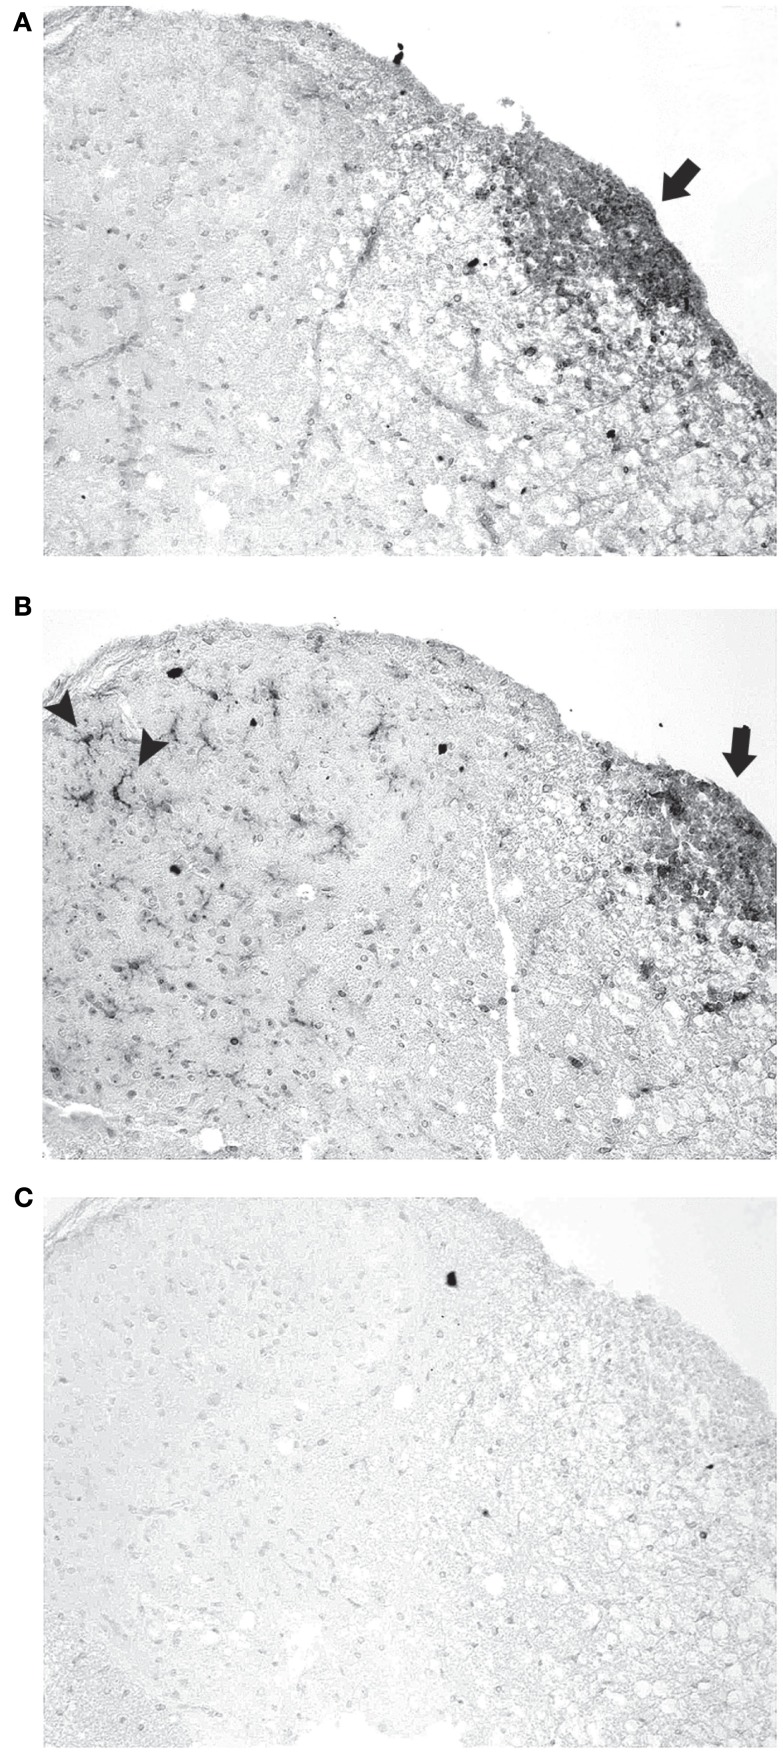
Figure 5.
Inflammatory cell types detected in EAE spinal cord. (A) Section of a representative EAE spinal cord 30 days post-immunization stained with antibodies to CD3 shows numerous T cells mainly within the white matter (arrow). (B) An adjacent section stained with Iba1 antibodies demonstrates numerous macrophages/microglia in the same inflammatory focus (arrow) in the white matter, as well as individual microglia across the spinal cord white matter and gray matter (arrowheads). (C) Adjacent section stained with B220 antibodies shows B cells do not contribute significantly to observed foci of inflammation. Photos shown at original magnification ×20 (A–C).

