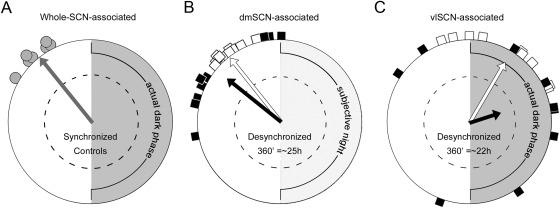
Fig. 5.
The circadian timing of the LH surge is coupled to an oscillator within the dorsomedial SCN. A, Polar plot and Raleigh test shows significant clustering of LH surge onset in control animals (gray circles, as in Fig. 4.C.) with a mean of 2.71 h before lights-off and locomotor activity onset. Vector direction indicates mean phase with 360° = 24 h, and vector length indicates significance (n = 7, Rayleigh test, P = 0.010; dotted circle indicates a P = 0.05). B and C, Same as for A but for LD22 OVX+E2 animals. Animals bled during misaligned (points as black squares, descriptive vector in black) and aligned days (points as white squares, descriptive vector in white) are represented in polar plots in which each individual animal's LH-surge onset is plotted relative to the period of one of its locomotor activity rhythms set equal to 360°. Thus, 360° corresponds to the period of the dmSCN-associated activity bout (∼25 h) (B) or to the period of the vlSCN-associated activity bout (22 h) (C). Note that the LH surges of animals bled during misaligned days do not significantly cluster relative to the period of the vlSCN-associated activity rhythm (black arrow in C does not reach significance). LD22 Rayleigh tests: B, Days of alignment: n = 10, P = 0.0018, mean phase 2.49 h before locomotor activity onset; days of misalignment: n = 9, P = 0.013, mean phase 3.35 h before locomotor activity onset; C, Days of alignment: n = 10, P = 0.007, mean phase 2.07 h after lights-off and locomotor activity onset; days of misalignment: n = 9, P = 0.23.

