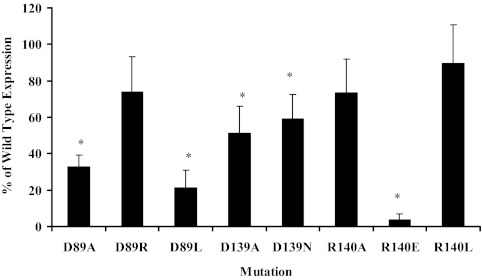
Fig. 3.
Anti-HA ELISA on A-427 cells transiently transfected with the mutated receptors. The data are shown as the percent expression compared with the wild-type receptor for each mutant. Each bar represents the mean ± sem of three to six experiments, with each experiment consisting of triplicate data points. *, Significant difference (P ≤ 0.024) compared with the wild type.

