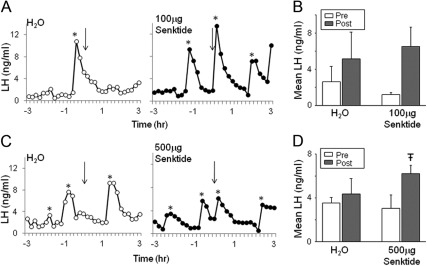
Fig. 1.
A, LH profiles from individual prepubertal ewes that were treated with water (open circles) or 100 μg of senktide (closed circles). B, Mean LH 24 min before (Pre) and 24 min after (Post) iv injection. C, LH profiles from individual prepubertal ewes that were treated with water (open circles) or 500 μg of senktide (closed circles). D, Mean LH 24 min before (Pre) and 24 min after (Post) iv injection. Arrows indicate time of iv injection. *, LH pulses. Significance (P < 0.05) is indicated by [stroke]T.

