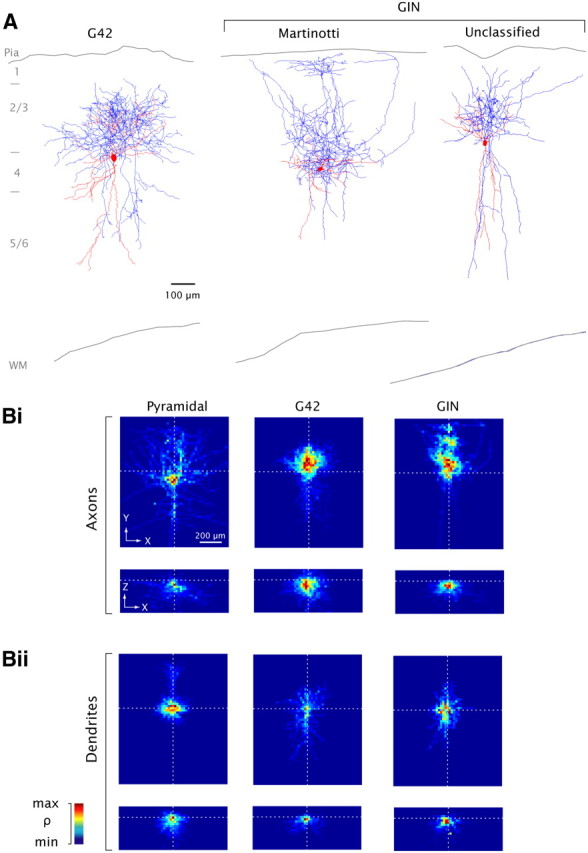
Figure 2.

Anatomical reconstruction. A, representative G42 (left) and GIN neurons (middle, right). Red, soma and dendrites; blue, axons. Approximate laminar boundaries and outlines of pia and white matter (WM) are indicated. B, Average process length density (ρ) maps for all reconstructed cells of each type, with somata aligned (see Materials and Methods, Morphology). n = 7 cells of each type (axons), n = 5 (dendrites), except for GIN neurons where n = 5 (dendrites), n = 3 (axons). The 3-dimensional process length density maps are projected onto the XY plane (Bi, Bii, top) and the XZ plane (Bi, Bii, bottom). Values are normalized separately for each panel.
