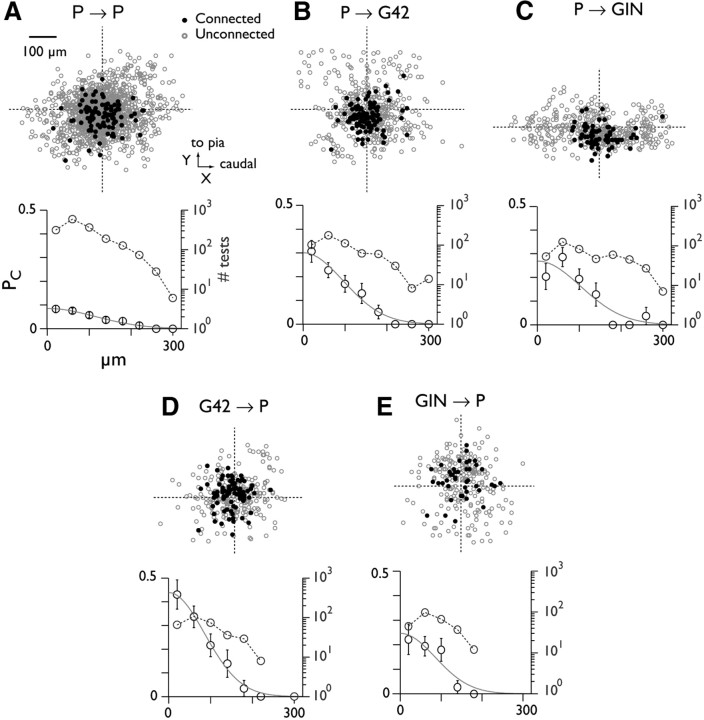
Figure 4.
Synaptic PC versus intersomatic distance. A, Data for pyramid-pyramid pairs. Top, scatter plot showing location of unconnected (gray) and connected (black) postsynaptic somata relative to the presynaptically tested cell (intersection of dashed lines). Bottom, connection probability (mean ± SEM; circles with error bars) versus radial distance between somata. Data are divided into 40 μm bins. Curves are Gaussian fits to the data. Circles with dashed line denote the number of tests at each distance (right-hand axis; note log scale). B–E, Data for pyramid-interneuron connections.

