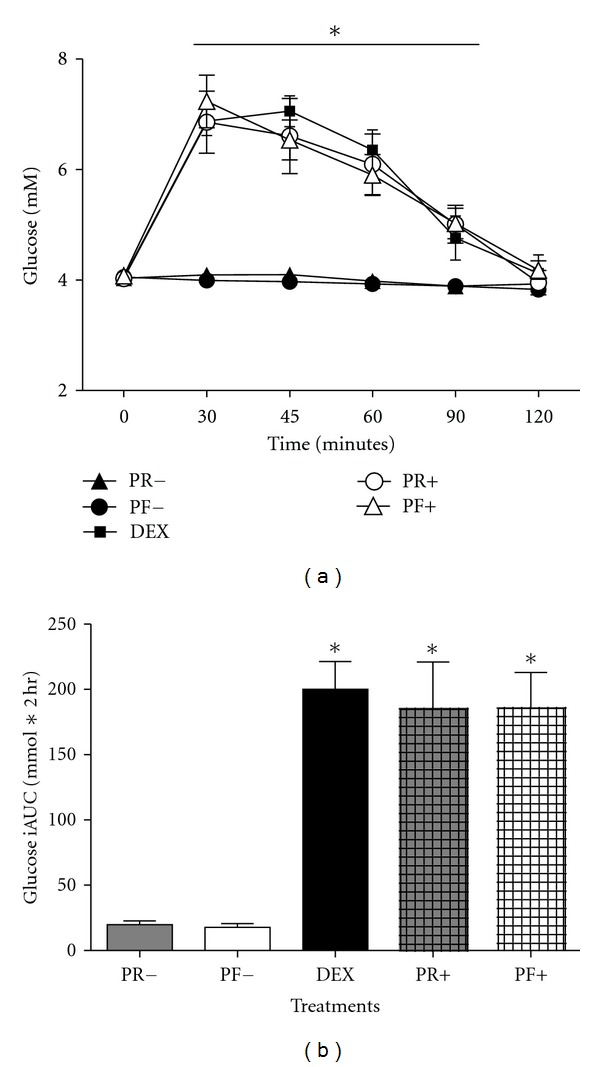
Figure 1.

(a) The glucose responses to 38 g of resistant starches with water only (PR− and PF−), with 50 g of dextrose (PR+ and PF+), and 50 g of dextrose only (DEX). * = P < 0.05 for differences between PF− and PR− compared with DEX, PF+, and PR+, from 30 minutes to 90 minutes, means ± SD. (b) The iAUC values for each treatment. * = different (P < 0.0001) from PF− and PR−, means ± SEM.
