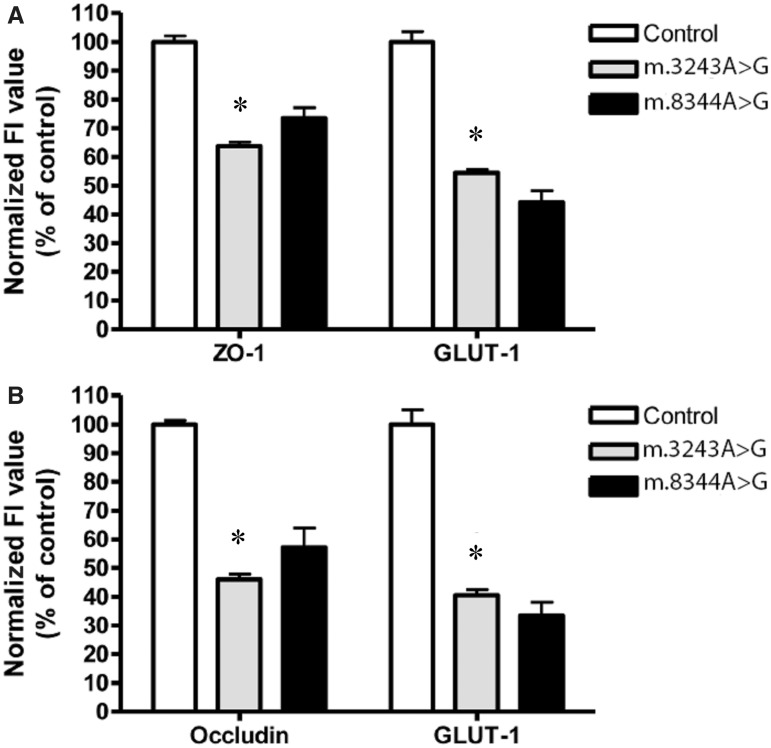
Figure 5.
Quantification of the degree of immunoreactivity/expression of tight junction proteins ZO-1 and occludin, and the level of the endothelial marker GLUT1 in the deep white matter of the cerebellum that had been co-expressed with the relevant tight junction protein. Mean fluorescence intensity (FI; in percentage) of ZO-1 co-expressed with GLUT1 in vessels of patients harbouring m.3243A>G and m.8344A>G mutations normalized to control tissue (A). Mean fluorescence intensity (in percentage) of occludin co-expressed with GLUT1 in m.3243A>G and m.8344A>G specimens normalized to control tissue (B). In each case, the mean control fluorescence intensity was calculated as 100% (mean ± SD). Statistically significant differences between control and m.3243A>G vessels were detected by using the Wilcoxon-Rank Sum Test. Changes in mean fluorescence intensity were detected as highly significant for all proteins examined (*P < 0.05).

