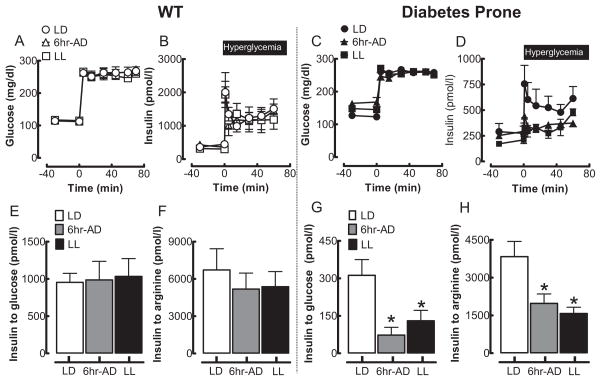
Figure 3.
Effects of 10-week circadian rhythm disruption on pancreatic beta-cell function in WT and HIP rats. Mean plasma glucose (A, C) and insulin (B, D) concentrations during the hyperglycemic clamp in WT (left panels) and diabetes-prone HIP rats (right panels) following 10-week exposure to LD (open and closed circles), LL (open and filled squares), or 6-h advance (open and filled triangles) regimen. Mean insulin response to glucose (E, G) and arginine (F, H) challenge during the hyperglycemic clamp in WT (left panel) and diabetes-prone HIP (right panels) rats following 10-week exposure to LD (open and closed circles), LL (open and filled squares), or 6-h advances (open and filled triangles) regimen. Data are expressed as mean ± SEM. *p < 0.05 statistical significance for insulin response to glucose and arginine vs. LD HIP.

