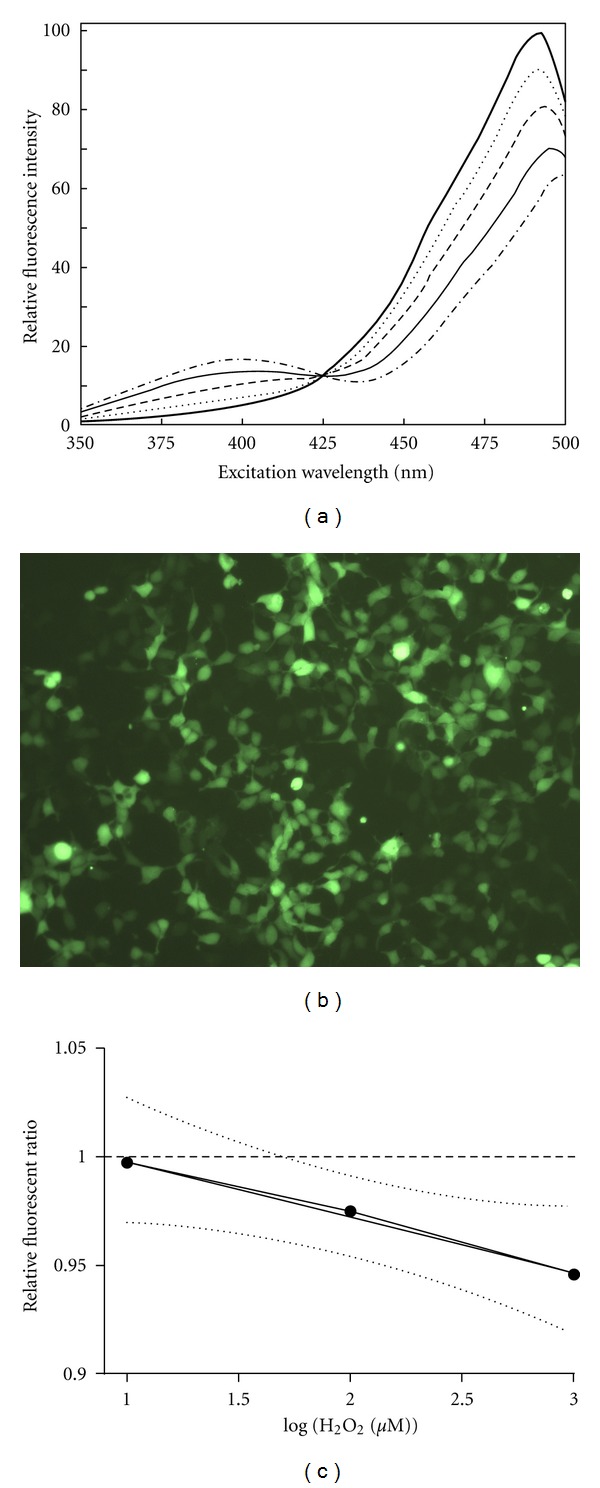
Figure 1.

Different aspects of roGFP as marker for oxidative changes in cells. (a) Emission intensity of roGFP measured at serial excitation points. The flat line represents reductive conditions while the semidotted line represents oxidative conditions. The lines in between are different levels of red-ox conditions (image modified from Hanson et al. [25]) (b) Image of HEK293 cells stably transfected with roGFP. (c) Linear regression of log-transformed concentration of H2O2 in roGFP cells. Slope is −0.02617 ± 0.004004, Y intercept when X = 0 is 1.027 ± 0.008649, and R2 is 0.8104.
