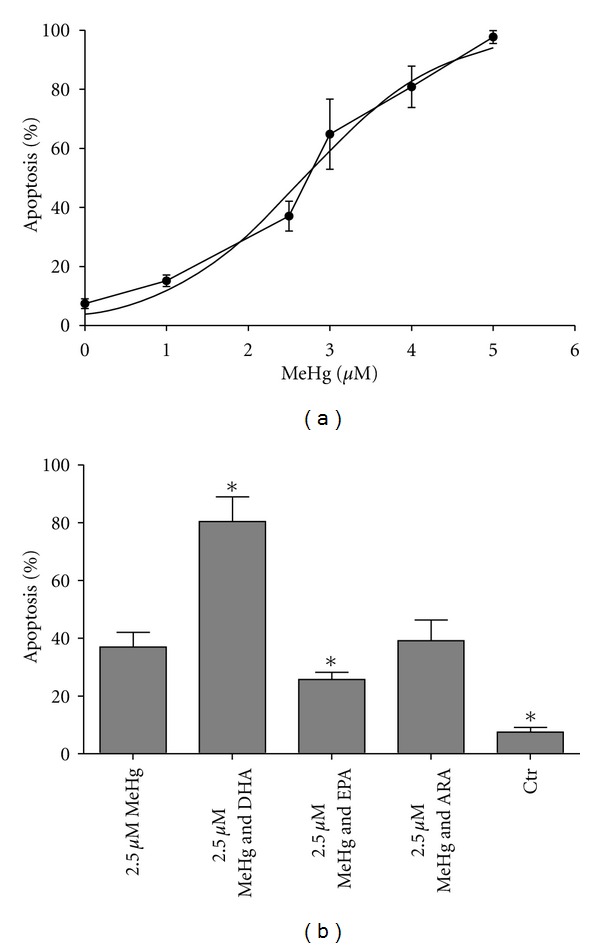
Figure 4.

Apoptosis count of ASK cells after treatment with FA and MeHg. (a) MeHg dose-response with curve following a logarithmic nonlinear curve disposition (r2 = 0.9564); from this curve a concentration which gave 40% apoptosis (approx. 2.5 μM MeHg) was used in assay including fatty acids. (b) Apoptosis count after preincubation of cells with fatty acids. Results are presented as mean ± SD. Statistical differences are revealed by one-way ANOVA and post hoc Dunnett's test where n = 4. Significant differences compared to 2.5 μM MeHg (P ≤ 0.05) are indicated by asterix.
