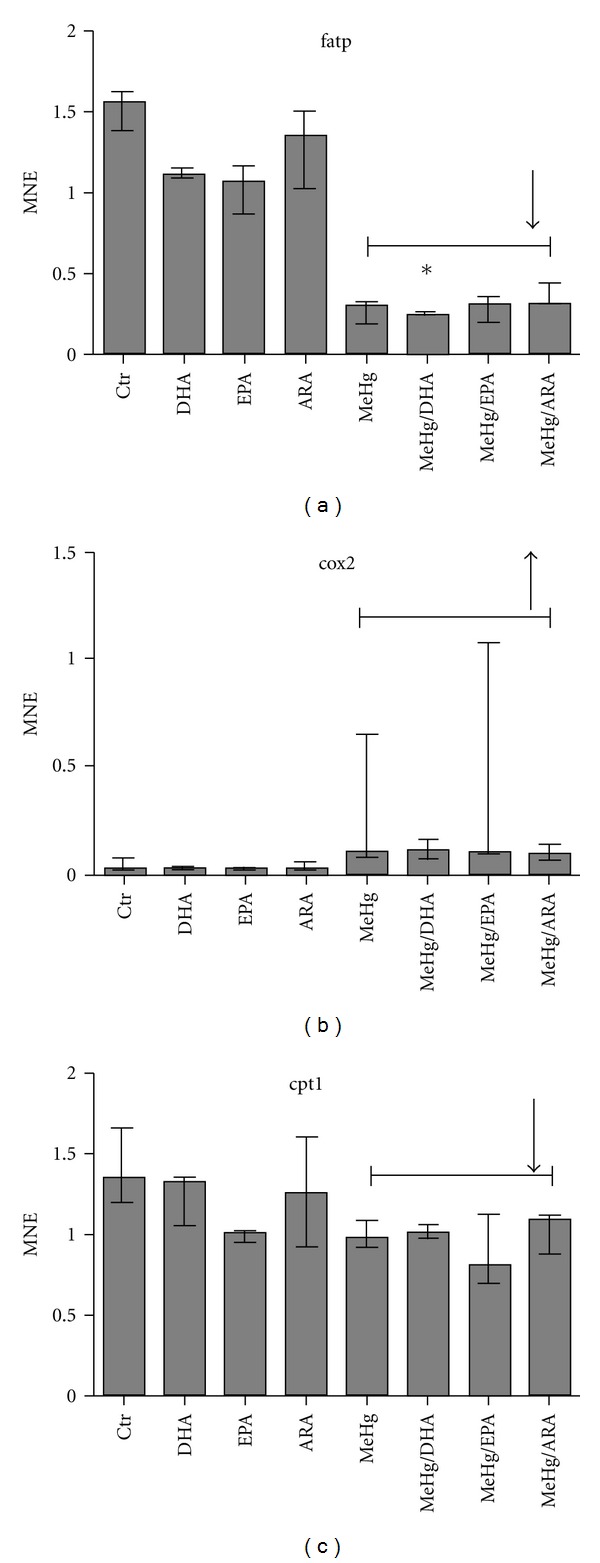
Figure 6.

Mean-normalized expression (MNE) of (a) fatp, (b) cox2, and (c) cpt1 in ASK cells. Data are represented by median, with error bars representing interquartile range. Data are treated through factorial design, where n = 3 for all groups (columns shown), and significant differences (P ≤ 0.05) are indicated by asterix. MeHg and FA effects were calculated across groups where n = 12 and n = 6, respectively. Significant effects (P ≤ 0.05) of MeHg are shown using bracket lines. Fatty acid effects compared to control are shown by the letters FA. Statistical analysis was performed using nonparametric Kruskal Willis with post hoc paired comparisons.
