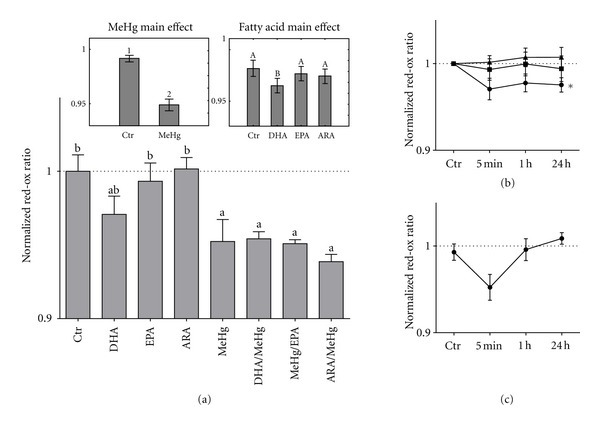
Figure 7.

Fatty acid and MeHg effect on red/ox balance in HEK293 cells. (a) Relative fluorescent value of the cells 5 minutes after exposure to the different compounds. Data are treated by two-way ANOVA and main effects analyzed by post hoc Fischer's test. Significant differences (P < 0.05) due to MeHg exposure (MeHg main effect) are represented using lettering. Significant differences (P < 0.05) due to fatty acid treatment (fatty acid main effect) are represented using large letters. Interaction effects were analyzed using post hoc Dunnett's test where significant differences (P < 0.05) compared to control are visualized by small letter a, while significant differences (P < 0.05) compared to MeHg are visualized using small letter b. Dotted line represents normalized control values. (b) Relative fluorescent ratio of fatty acids compared to control over time. Circles represent DHA, squares represent EPA, and triangles represent ARA. The dotted line represents normalized control values. Data are treated with one-way ANOVA followed by a post hoc Dunnett's test; lines significantly different (P < 0.05) from control are marked with ∗. (c) Relative fluorescent ratio of MeHg compared to control over time. Black dots represent MeHg, while the dotted line represents normalized control values. Error margins are signified using standard deviation.
