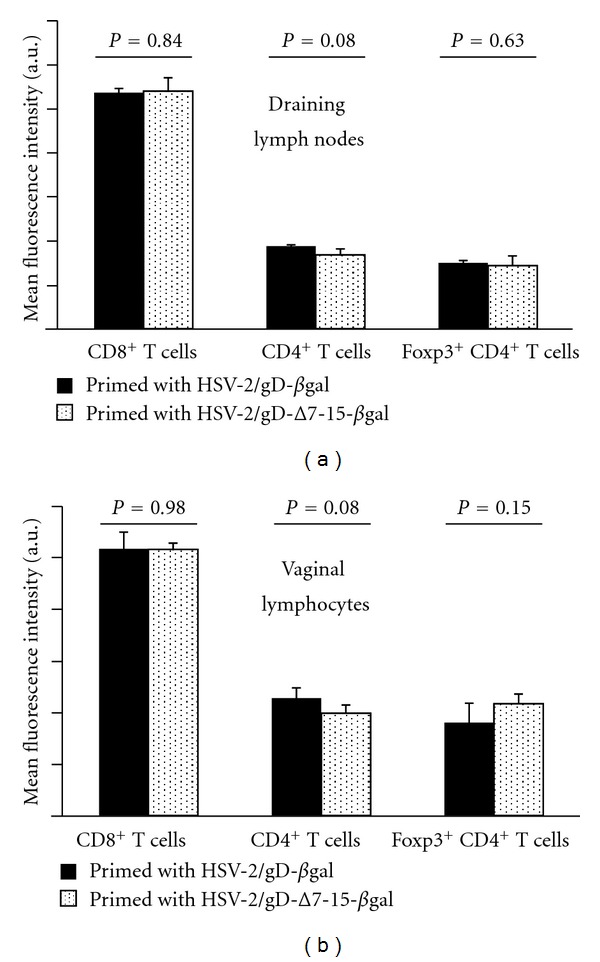
Figure 6.

CXCR3 expression on CD8+, CD4+, and Foxp3+ CD4+ T cells does not statistically differ between groups of mice primed with viruses that can (HSV-2/gD-βgal, black bars) or cannot (HSV-2/gD-Δ7-15-βgal, stippled bars) engage HVEM. Gates were chosen to exclude nonspecifically labeled cells based on isotype control antibody staining. Data are expressed as mean fluorescence intensity (MFI) of the indicated cell population from 3-4 mice per condition, plus the standard deviation. P values reflect differences in mean CXCR3 MFI for each cell population between groups of mice primed with the different viruses.
