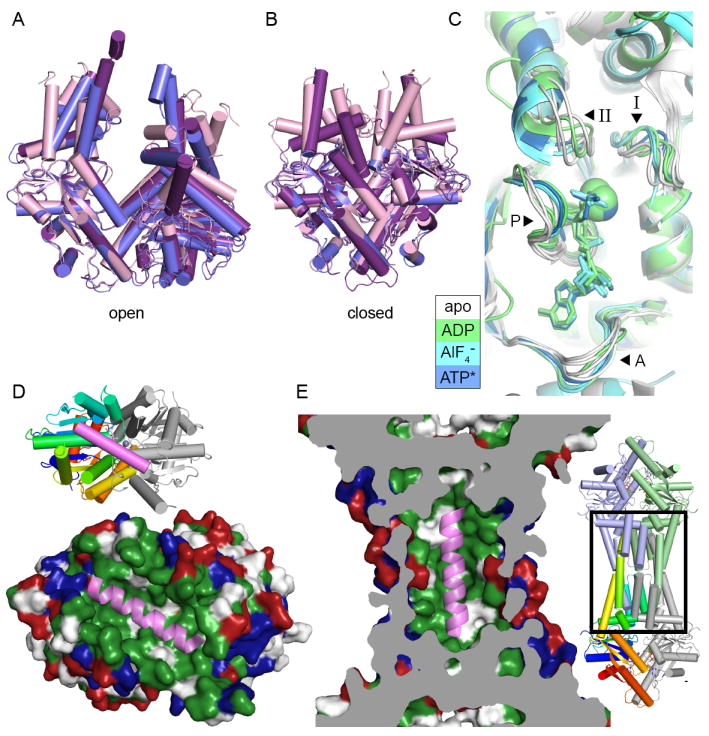
Figure 2. Conformations of Get3 and models for TA binding.

A. Open form structures of Get3 in a cartoon representation aligned by the right subunit, using PDB IDs 3A36 (purple), 3H84 (blue) and 2WOO (pink). B. Closed form structures shown as in A, using PDB IDs 3IQW (purple), 3IO3 (blue) and 2WOJ (pink). C. The NHD of aligned Get3 structures from one subunit. Motifs are indicated with arrowheads and labeled A (A-loop), P (P-loop), I (switch I) and II (switch II). Structures are colored according to the nucleotide bound with white for no nucleotide (PDB ID: 3A36, PDB ID: 2WOO, PDB ID: 3SJA and PDB ID: 3SJC), green for ADP (PDB ID: 3IQX and PDB ID: 3SJD), cyan for ADP·AlF4− (PDB ID: 2WOJ, PDB ID: 3ZQ6 and PDB ID: 3ZS9) and blue for AMPPNP (PDB ID: 3IQW). D. A model for TA binding by the Get3 dimer [9]. Get3 (PDB ID: 2WOJ) is shown in a surface representation colored hydrophobic (green), positively (blue) and negatively charged (red). A cartoon representation of a TA from Secβ (PDB ID: 1RHZ), colored pink, is shown in the groove formed in the closed structure of Get3. The inset shows a cartoon representation of Get3 with the left subunit colored ramped and the right subunit in gray. E. A TA binding model for a tetramer of Get3 [10] represented as in D. The structure of tetrameric Get3 (PDB ID: 3UG6) is cut away to show the central cavity with a TA modeled inside, similar to D. The area shown is indicated with a box on the overall structure in the inset.
