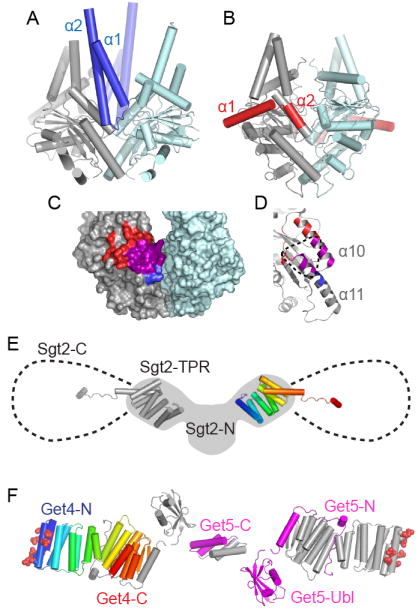
Figure 4. Interactions between Get3 and other Get pathway members.

A. Crystal structure of Get3 in complex with the Get1 cytoplasmic domain (blue) (PDB ID 3ZS8). One Get3 subunit is gray and the other pale blue. B. Crystal structure of Get3 in complex with the Get2 cytoplasmic domain (red) (PDB ID: 3SJD). C. Surface rendering of open Get3 (PDB ID: 3A36). Regions where Get1 (blue) and Get2 (red) interact with the gray subunit are highlighted, with the overlapping region in magenta. D. Close up of Get3 α10 and α11, colored as in C. The expected Get4 binding interface is indicated with a dotted line. E. Model of the structure of Sgt2. Two copies of the TPR domain (PDB ID: 3SZ7) are displayed over a cartoon of a SAXS model of the N-terminal dimerization and TPR domains (gray, adapted from [35]). The additional 107 residues of the C-terminal domains rotate freely from the TPR and a potential range of motion is indicated with dotted lines. F. Structure of the Get4/Get5 heterotetramer. Residues shown to be critical for Get3 interaction are shown as spheres [35]. Subunits are arranged based upon SAXS models [31]. One copy of Get4 is color ramped from N- (blue) to C- (red) termini. One copy of Get5 is colored magenta and the remaining Get4 and Get5 subunits are gray.
