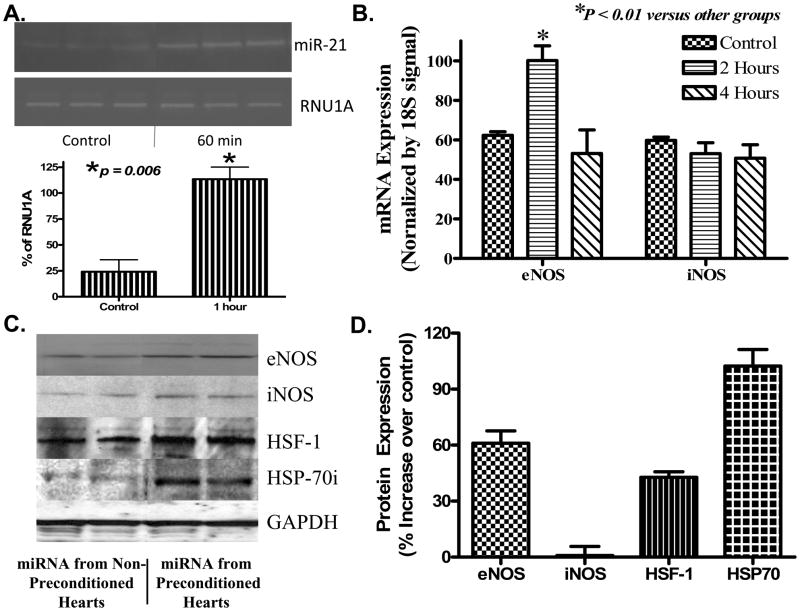
Figure 3. Effect of miRNA on induction of cardioprotective proteins.
(A)Uptake of miRNA-21 following injection in LV wall. Top panel: gel electrophoresis image of the RT-PCR for miRNA-21; Bottom panel: average normalized changes in miRNA-21. Endogenous U1A small nuclear RNA (RNU1A) was used as control. (B) R-T PCR showing eNOS and iNOS mRNA levels. A significant increase in eNOS was noted 2 h following treatment with IPC-miRNA. (C) Representative western blot showing expression of eNOS, iNOS, HSF-1 at 4 h and HSP 70 at 48 h following treatment with IPC-miRNA or non-IPC-miRNA control. (D) Bar diagram showing average % increase in proteins shown in ‘B’. Results are means±SEM from 3 independent hearts per group.

