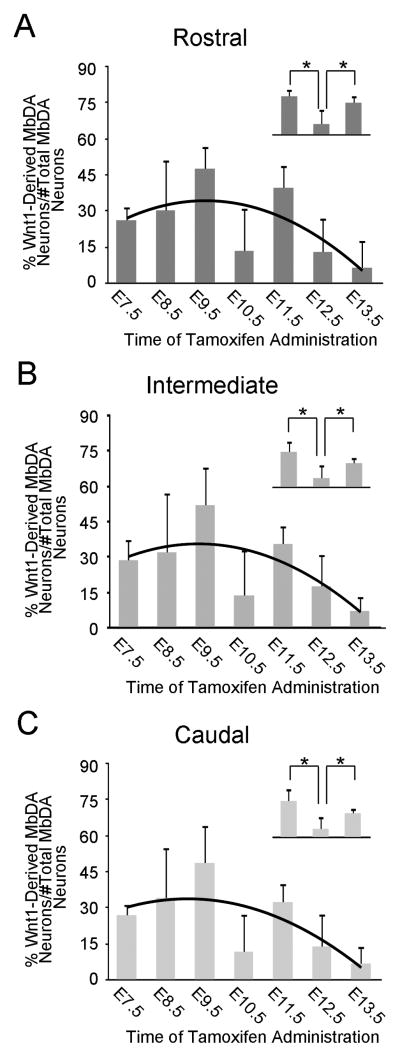
Figure 13.
The relative contribution of Wnt1-expressing cells to rostral, intermediate, and caudal MbDA neurons. A–C: The percentage of MbDA neurons in the rostral (A), intermediate (B), and caudal (C) spatial domains marked by GIFM with tamoxifen administration between E7.5–E13.5. The counting frames that were used for group analysis are shown in Fig. 9 and were applied in the following manner: (rostral: Fig. 9H1–2, I4, J3, J7, K4, K6–8, L1–2; intermediate: Fig. 9I1, J2, J6, K3, K5; caudal: Fig. 9I2-3, J1, J4–5, K1–2). The contribution of the Wnt1 lineage to rostral, intermediate, and caudal MbDA neurons follows a regression model (black trend line) similar to the model for the contribution of the Wnt1 lineage to MbDA neurons as a whole. A–C, insets. Orthogonal linear contrast models showing that the Wnt1 lineage contribution to the rostral, intermediate, and caudal MbDA neurons at E10.5 was significantly less than at E9.5 or E11.5; * indicates p<0.0001.

