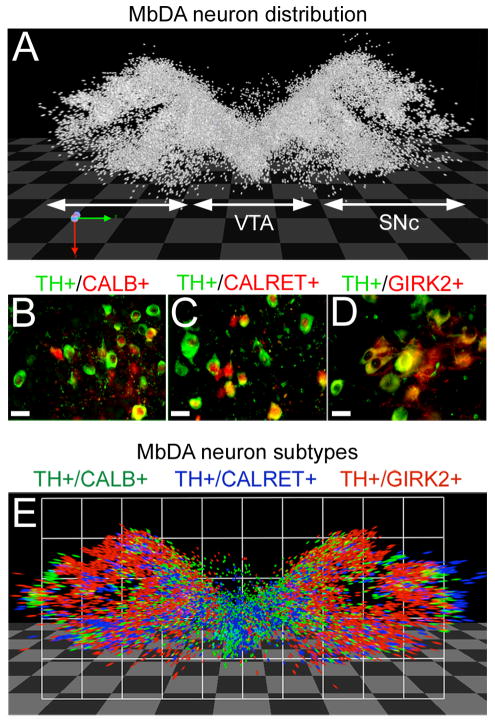
Figure 5.
The distribution of MbDA neurons in adult mouse. A: Each individual MbDA neuron was analyzed in forty horizontal sections that contain all adult MbDA neurons. On each 40 μm thick section, a dot was placed on immunolabeled (TH+) MbDA neuron and reconstructed in three dimensions using Volocity 3D module to show the full distribution of MbDA neurons; the VTA and SNc are indicated. B–D: Adjacent sections were immunolabeled for TH (green) and the indicated marker (red) to label MbDA neuron subtypes. E: The three dimensional distribution of MbDA neuron subtypes. Scale bar = 32μm (B–D).

