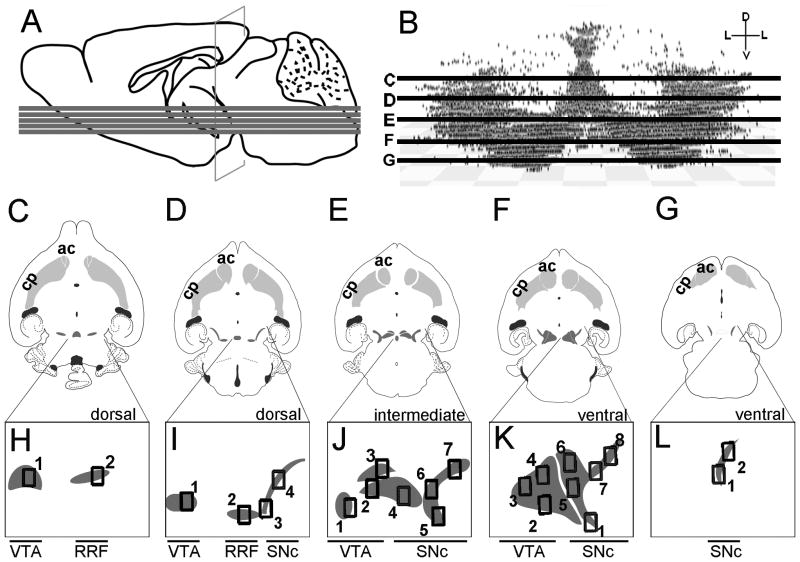
Figure 9.
Anatomical levels used for quantitative GIFM analysis of the Wnt1 lineage contribution to adult MbDA neurons. A: Mid-sagittal schematic of an adult brain showing the relative locations of the five horizontal planes used for analysis. B: Three-dimensional reconstruction of MbDA neuron distribution plotted along the dorsal-ventral axis and showing planes analyzed: dorsal-most (C), dorsal (D), intermediate (E), ventral (F), and ventral-most (G) C–G: Illustrations of MbDA neuron populations (dark gray shading) in context of their projections to the target striatum (gray). The domain encompassing MbDA neurons is smaller in the most dorsal planes (C,D) compared to intermediate (E) and ventral (F) horizontal sections. In the intermediate horizontal section (E), and the ventral horizontal section (F), both the lateral SNc and the medial VTA are prominent. In the ventral-most horizontal section (G), the lateral SNc is a relatively small domain and the medial VTA is absent. Note that retrorubral field (RRF) MbDA neurons are present in the dorsal sections (C,D), but is absent in more ventral sections (E–G). H–L: Images of MbDA neuron populations in the most dorsal (H), dorsal(I), intermediate (J), ventral (K), and most ventral (L) are shown below their respective illustrations. The numbered boxes indicate where counting frames were placed to sample the relative contribution of the Wnt1 lineage to distinct MbDA subdomains in dorsal-ventral planes shown. The counting frames were organized in the following manner to analyze specific domains. Medial to lateral MbDA neurons (analyzed in Fig. 12): medial (H1, I1, J1–3, K2–4); intermediate (H2, I2), lateral (I3–4, J4–7, K1, K5–8, L1–2). Rostral to caudal MbDA neurons (analyzed in Fig. 13 ): rostral (H1–2, I4, J3, J7, K4, K6–8, L1–2), intermediate (I1, J2, J6, K3, K5), caudal (I2–3, J1, J4–5, K1–2). Dorsal to ventral MbDA neurons (analyzed in Fig. 14 ): dorsal (all counting frames in H and I); intermediate (all counting frames in J), ventral (all counting frames in K–L).

