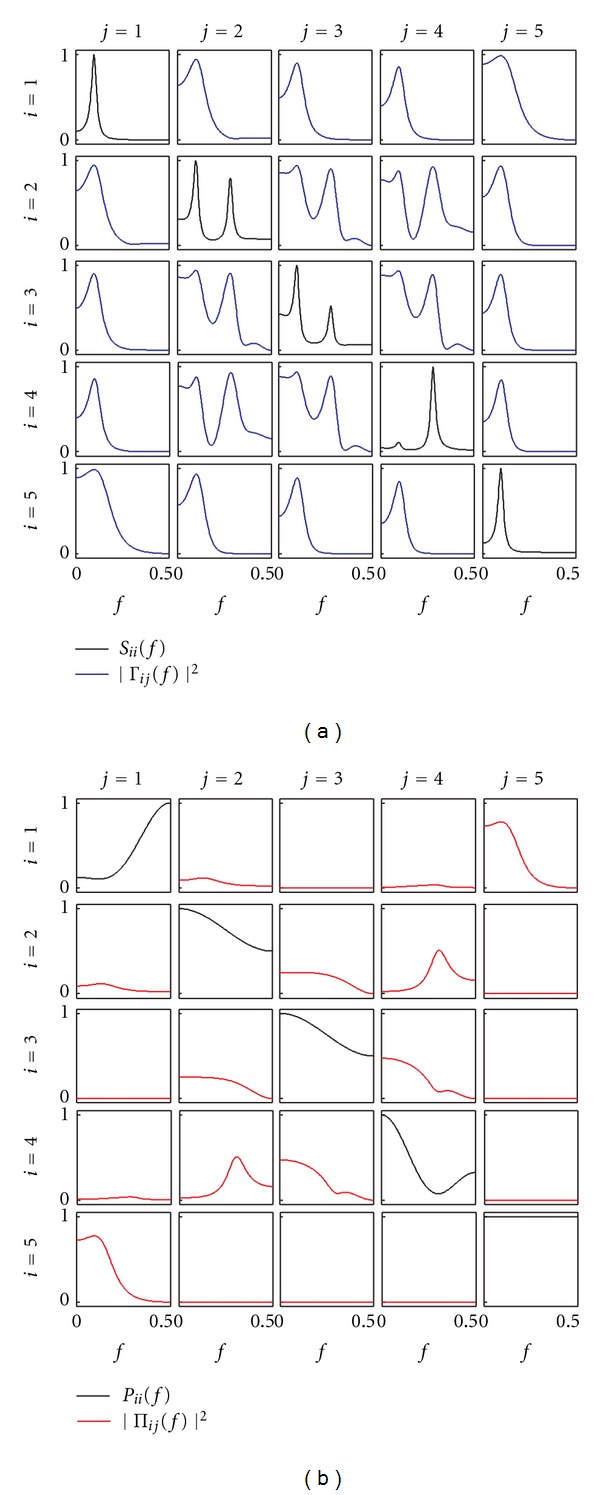
Figure 3.

Spectral functions and frequency domain measures of coupling for the illustrative MVAR process of (4). (a) Power spectral density of the process y i (S ii(f), black) and coherence between y i and y j (|Γij(f)|2, blue). (b) Inverse power spectral density of y i (P ii(f), black) and partial coherence between y i and y j (|Πij(f)|2, red).
