
Figure 5.
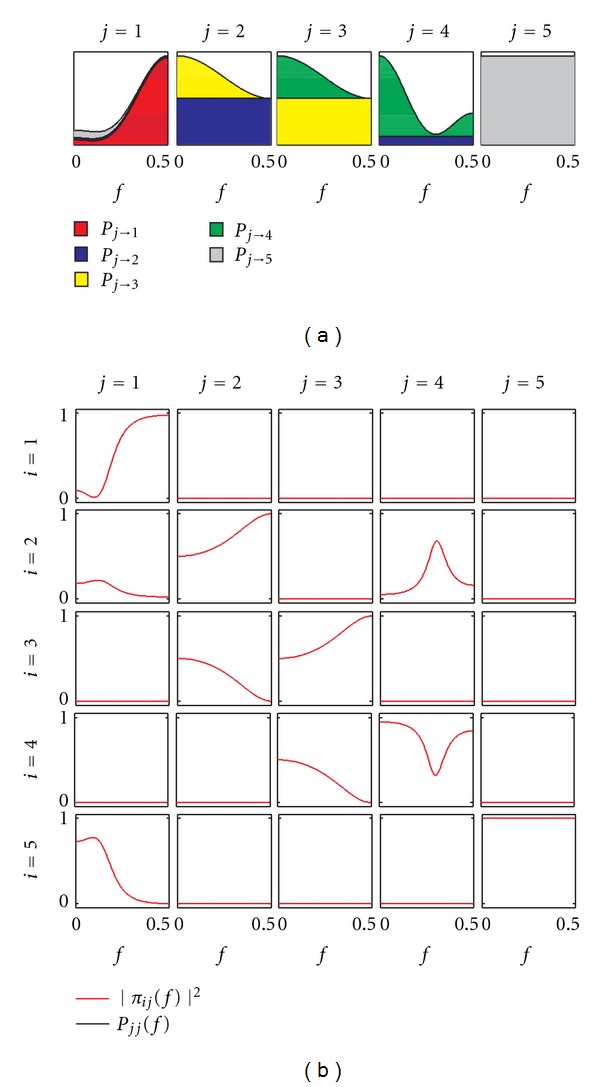
Decomposition of the inverse power spectrum of each process y i in (4), P jj(f), into contributions directed towards each process y i (P j→i, shaded areas in each plot) (a), and corresponding squared PDC from y j to y i, |π ij(f)|2 (b) depicted for each i, j = 1,…, M.