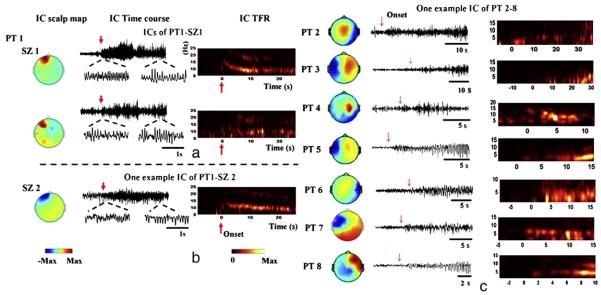
Fig. 2.
Examples of independent components identified in the 8 patients. (a) In one seizure recorded in patient 1, two independent components (ICs) were identified as seizure components. The IC time courses show ictal rhythms with increased frequency at seizure onset (red arrows) and decreased frequency in alpha band later. The IC TFRs further confirm the time–frequency evolution of ictal rhythms represented in the seizure components. The IC scalp maps indicate significant activation recorded in the left frontal electrodes with certain spread to temporal electrodes in the 2nd component. Other seizures recorded in the same patient showed similar spatial and temporal patterns of the independent components. (b) One example IC in seizure 2 of patient 1 showed similar spatial and temporal patterns. (c) Patients 2–8 presented with temporal lobe seizures. Multiple components were identified in each patient but only one example IC in each of the patients is shown here.

