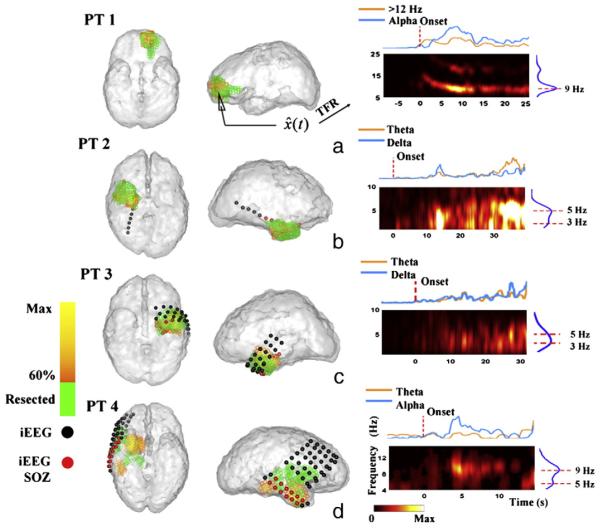
Fig. 3.
Seizure onset zones (SOZs) and the source TFRs estimated from a typical seizure in each of the patient 1–4. (a–d) The estimated SOZ (left and middle panels, 60% threshold, yellow to orange colorbar) is co-localized with surgically resected zones (shown in green) in patients 1–3, and SPECT foci (green) in patient 4. The TFR (right panels) shows the time– frequency evolution at the maximal estimated SOZ point. Intracranial electrodes were implanted in patient 2–4 (c–d, spherical dots). Epileptologists identified that seizures were initiated in (c) right temporal depth electrode (RTD) #1–3 (red spherical dots) in patient 2; (d) left anterior depth electrode (LAD) #1–3 (red spherical dots), left posterior depth electrode (LPD) #1–3 (red spherical dots), and left anterior temporal strip (LAT) #1–2 (red spherical dots) in patient 3; and (e) right inferior temporal strip (RIT) #2–7 (red spherical dots), and right mid-temporal strip (RMT) #2–7 (red spherical dots) in right temporal onset seizures in patient 4. Other grids/strips/depth electrodes not identified by epileptologists as SOZ were not shown in the figures.

