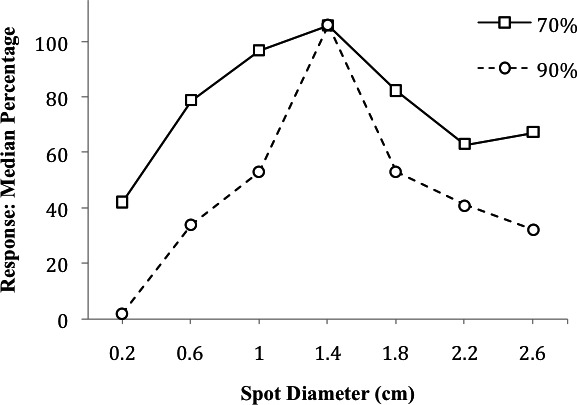
Figure 1.

Median percentage of responses at various test stimulus sizes as a function of deprivation level. In this study, pigeons were trained to respond to a 1.4-cm spot and were tested with the other untrained sizes when maintained at 70% (high deprivation) and 90% (low deprivation) of free-feeding weights. This figure is based on data reported by Jenkins et al. (1958, Figure 1).
