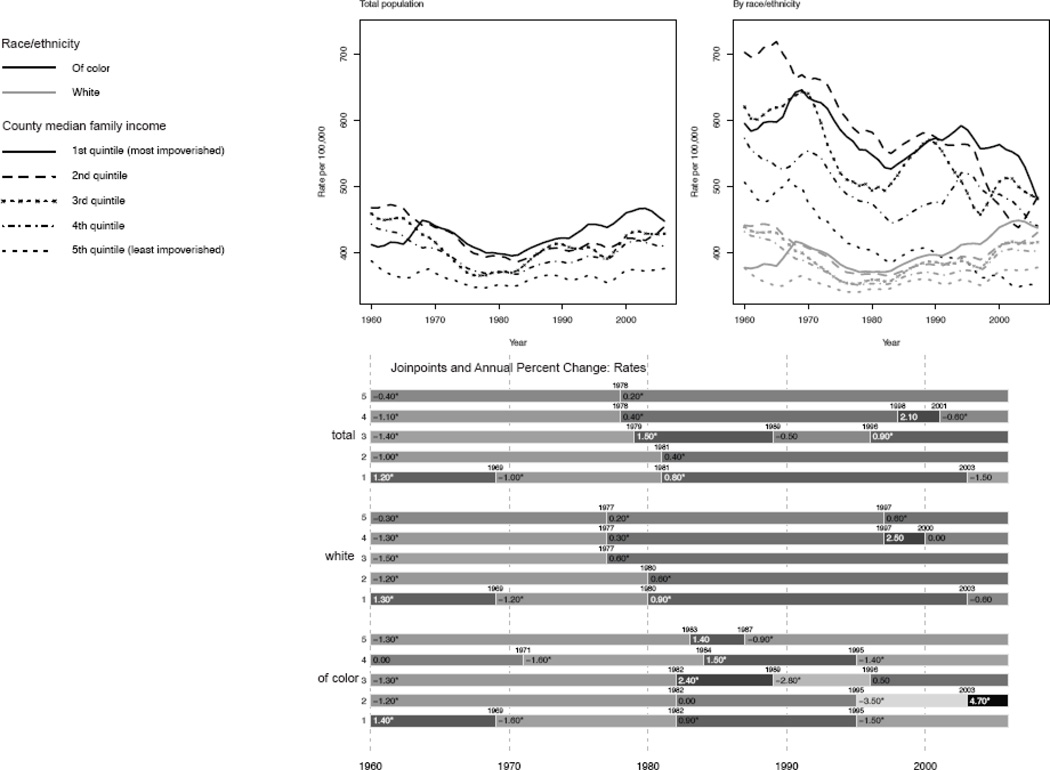
Figure 2.
Mortality rate for: (a) deaths unrelated to smoking (age-standardized to the Year 2000 standard million), and (b) deaths preventable by 1960s standards of medical care (age-standardized to the Year 2000 standard million), by county income quintile, joinpoints, and annual percent change (APC) (95% CI) between joinpoints for total population, white population, and populations of color: United States, 1960–2006.

