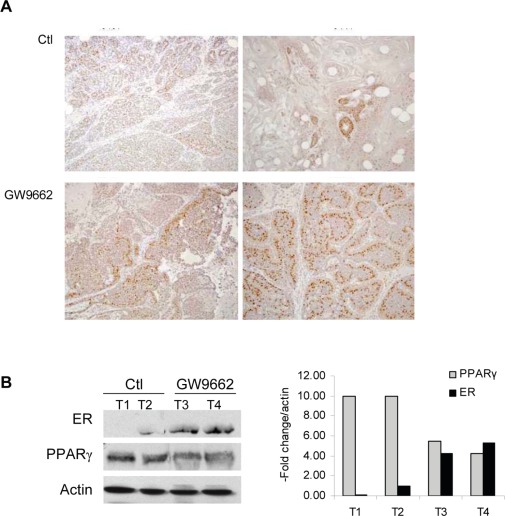
Figure 2. ER expression in adenocarcinomas from control and GW9662 mice.
(A) Immunohistochemical detection of ER expression. Two representative tumors from control and GW9662-treated mice are shown. ER expression was increased following GW9662 treatment. Magnification 200X. (B) Western analysis of ER and PPARγ expression. Two representative tumors from control and GW9662-treated mice are shown. ER expression was increased, and PPARγ expression reduced following GW9662 treatment. The bar graph represents quantitation of the western blot normalized to actin expression.

