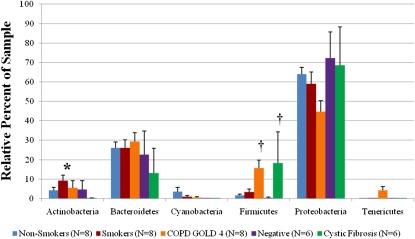
Figure 4.
Comparison among the nonsmoker control, smoker control, COPD (GOLD 4), cystic fibrosis, and negative control groups of the percent abundance of the major identified phyla within a sample. Histogram represents average ± SEM. *P < 0.007 versus all other groups. †P < 0.003 versus nonsmoking, smoking, and negative control groups. COPD = chronic obstructive pulmonary disease; GOLD = Global Initiative for COPD.

