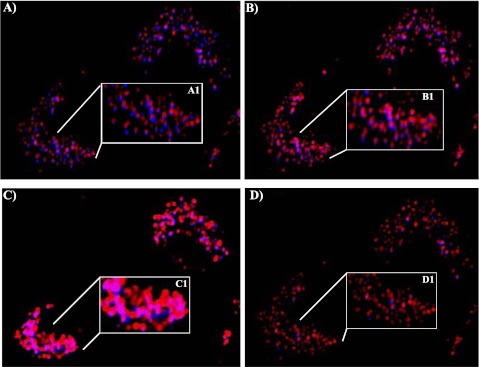
Figure 10.
Analysis of TICAM1 translocation using live cell imaging. TICAM-CFP was transfected into the cells. After 12 hours, dsRNA was treated and recorded at various time points. (A) Nontreated cells, time 0. (B) Twenty minutes after the addition of dsRNA. (C) One hour after the addition of dsRNA. (D) Three hours after the addition of dsRNA. Original magnification: ×20. Two cells were shown in the image (lower left and upper right corners). A1, B1, C1, and D1 were the magnified image from the indicated area in A, B, C, and D, respectively. Blue: TICAM1-CFP. Red: lysozymes labeled with lysoTracker. Purple: the overlap between TICAM1-CFP and lysosome. All images are representative of at least three independent experiments.

