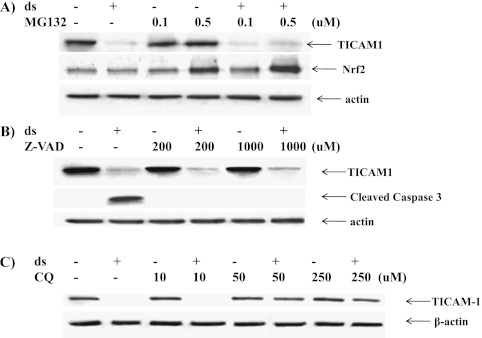
Figure 9.
(A) TICAM1 down-regulation was not affected by proteasome inhibition. NCI-H292 cells were treated with MG132 at the indicated dose or with DMSO (solvent control) for 1 hour, and then dsRNA or saline (in control) was added. Cellular protein was collected 3 hours later for Western blot analysis of TICAM1 and Nrf2, respectively. (B) TICAM1 down-regulation was not affected by caspase inhibition. NCIH292 cells were treated with zVAD at the indicated dose or DMSO (solvent control) for 1 hour, and then dsRNA or saline (in control) was added. Cellular protein was collected 3 hours later for Western blot analysis of TICAM1 and cleaved caspase 3 (indication of caspase 3 activation). (C) TICAM1 down-regulation was prevented by chloroquine (CQ). NCIH292 cells were treated with CQ at the indicated dose or DMSO (solvent control) for 1 hour, and then dsRNA or saline (in control) was added. Cellular protein was collected 3 hours later for Western blot analysis of TICAM1. Antiactin antibody was used as a control for loading. All images are representative of at least three independent experiments.

