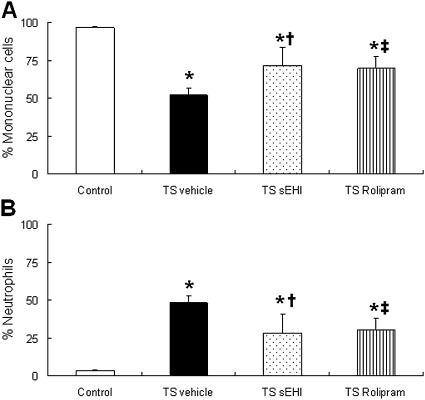
Figure 2.
Effects of t-TUCB and Rolipram on leukocyte profile in bronchoalveolar lavage. (A) Percent of mononuclear cells (including macrophages, monocytes, and lymphocytes). (B) Percentages of neutrophils in the bronchoalveolar lavage (BAL). Data are expressed as means ± SEM for 4–8 animals/group. *P < 0.05, TS-exposed groups were significantly different from control group. †P < 0.05, treatment group with sEHI t-TUCB was significantly different from the TS vehicle group. ‡P < 0.05, treatment group with Rolipram was significantly different from the TS vehicle group.

