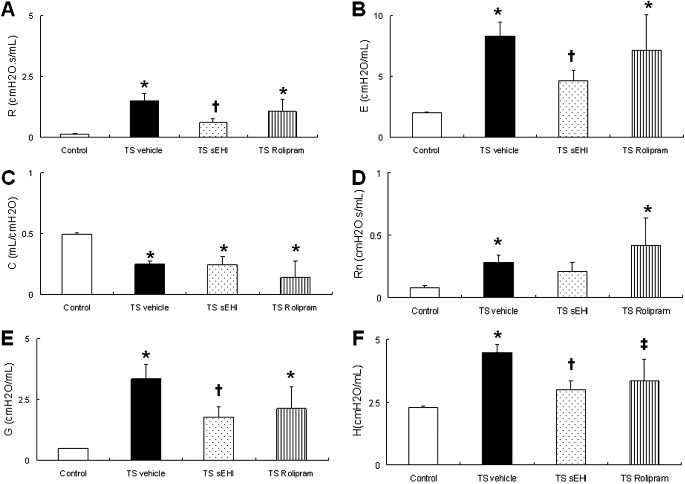
Figure 5.
Effects of t-TUCB and Rolipram on pulmonary function in the lung. (A) Total respiratory resistance (R) and (B) elastance (E), (C) compliance (C), (D) central airway resistance (Rn), (E) tissue damping (G), and (F) elastance (H) are shown. Data are expressed as means ± SEM for 4–8 animals/group. *P < 0.05, TS–exposed groups were significantly different from the control group. †P < 0.05, treatment group with sEHI t-TUCB was significantly different from the TS vehicle group. ‡P < 0.05, treatment group with Rolipram was significantly different from the TS vehicle group.

