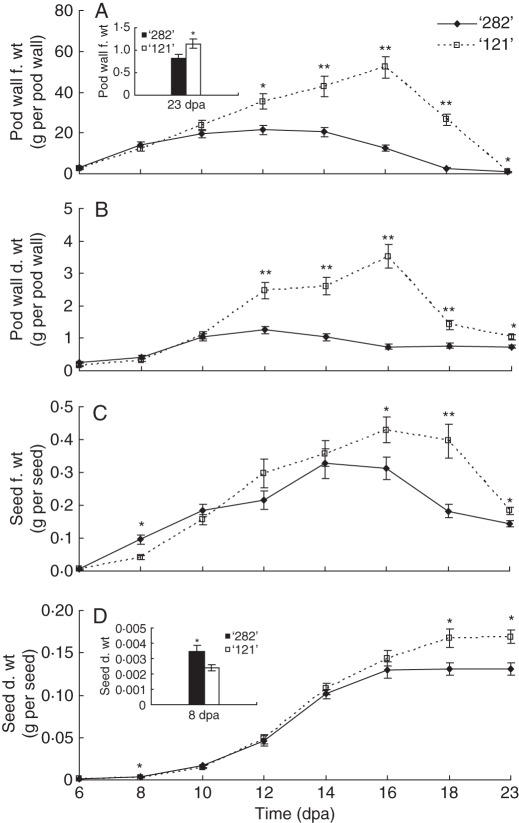
Fig. 2.
Growth kinetics of pod wall (A, B) and seed (C, D) of bulging seed pocket line ‘282’ and fleshy-pod line'121' on a fresh (A, C) or dry (B, D) weight basis. Each value represents mean ± s.e. of three biological replicates. For pod wall weights, each replicate includes four pod walls harvested from two plants. For seed weights, each replicate includes 50 normal seeds (shrunken seeds excluded) from eight pods harvested from four plants. Asterisks indicate significant differences (Student's t-test, *P < 0·05; **P < 0·01) between the two genotypes at each time point.

