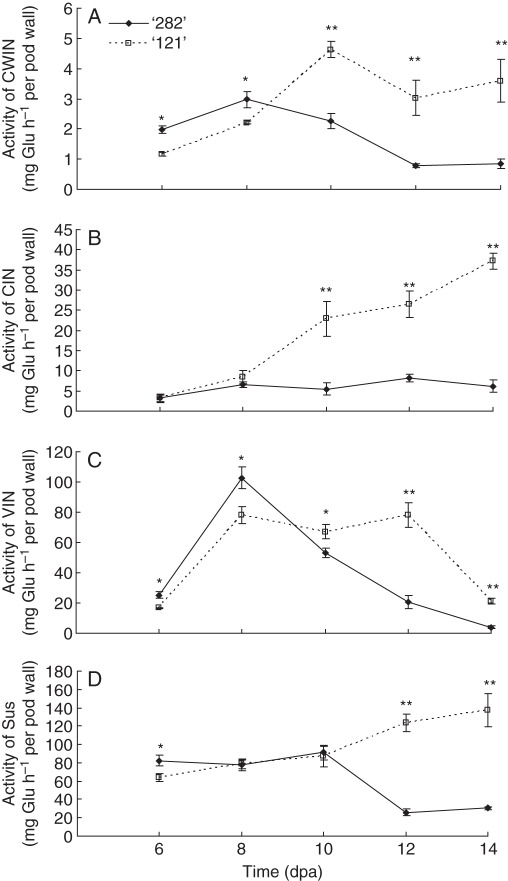
Fig. 3.
Activities of CWIN (A), CIN (B), VIN (C) and Sus (D) in pod walls of line ‘282’ and line ‘121’. Each value represents means ± s.e. of three biological replicates. Each replicate includes two pod walls harvested from two plants. When not visible, s.e. bars are smaller than the symbol. Asterisks indicate significant differences (Student's t-test, *P < 0·05; **P < 0·01) between the two genotypes at each tested time point.

