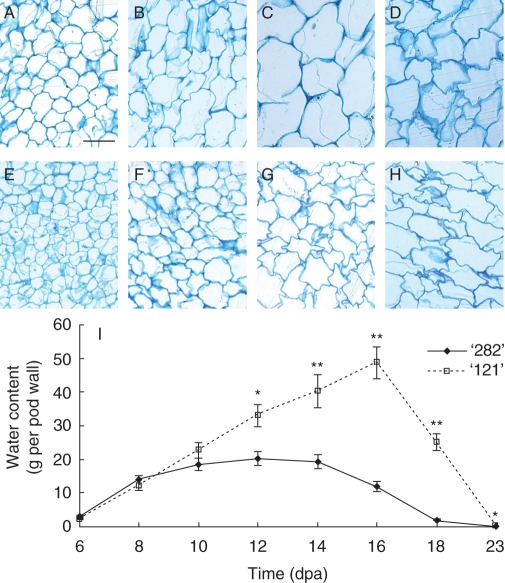
Fig. 4.
Developmental progression of cell expansion in pod walls (A–H). Transverse sections of pod walls were stained with methylene blue to show cell structure of lines ‘282’ (A–D) and ‘121’ (E–H) at 6 (A, E), 8 (B, F), 10 (C, G) and 12 (D, H) dpa. Cells in the bulging line ‘282’ appeared to have reached maximal size at 10 dpa and collapsed by 12 dpa (C vs. D). By contrast, cells in line ‘121’ continued to expand from 10 to 12 dpa (G vs. H). This indicates that bulging genotype line ‘282’ terminates cell expansion in pod walls earlier than line ‘121’. Scale bar = 50 µm (A, applies to all images). (I) Water content in pod wall of lines ‘282’ and ‘121’. Each value in represents mean ± s.e. of three biological replicates. Each replicate includes three pod walls harvested from three plants. Asterisks indicate significant differences (Student's t-test, *P < 0·05; **P < 0·01) between the two genotypes at each time point.

