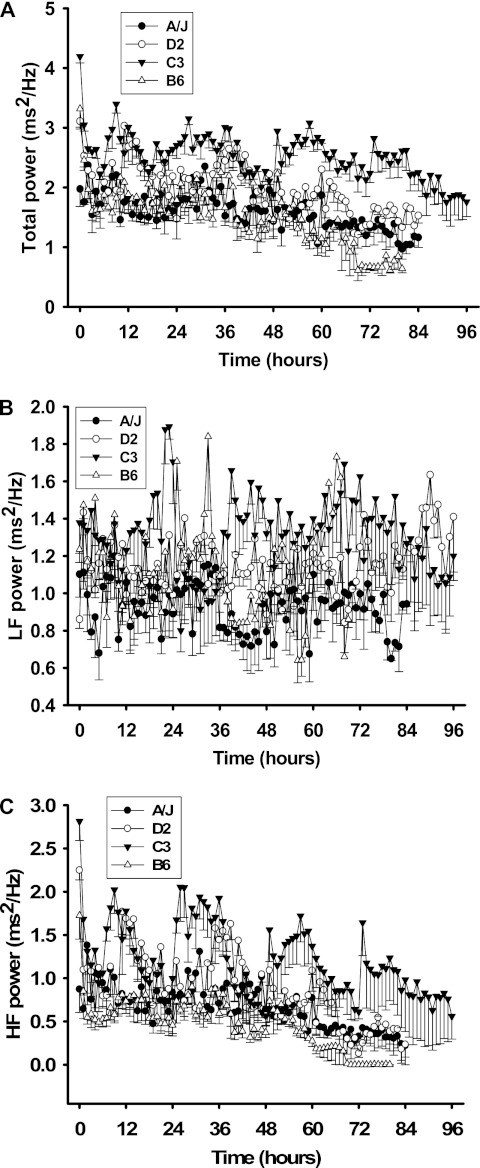
Figure 4.
Differential HR variability responses of four inbred strains. (A) Total power (TP) responses. TP is the summation of values from the low-frequency (LF) (B) and high-frequency (HF) (C) ranges acquired from individual mice. All values presented are means (±SEM) from 20 minutes of ECG recording per hour.

