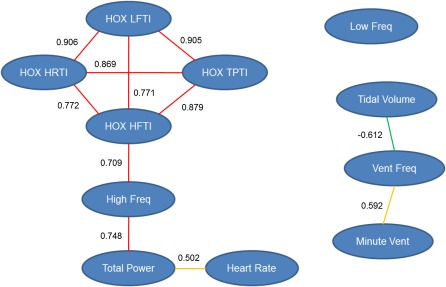
Figure 6.
Node and edge plot for association of basal and hyperoxia response phenotypes of AXB/BXA RI strains. HRTI and all HR variability TIs were significantly correlated with one another during exposure to hyperoxia. HF HR variability was the only basal phenotype correlated with the hyperoxia responses. Although the basal ventilatory parameters were related to one another as expected, they were not correlated with HR or any HRV phenotypes. Numbers beside the edges are Pearson correlation coefficients between phenotypes (nodes). Pearson correlation values are represented as: red edges, 0.7–1.0; orange edges, 0.5–0.7; green edges, −0.7 to −0.5. HOX, hyperoxia.

