
FIGURE 2. IL-1β and IGF-1 induce Bcl-2 expression in airway epithelial cells.
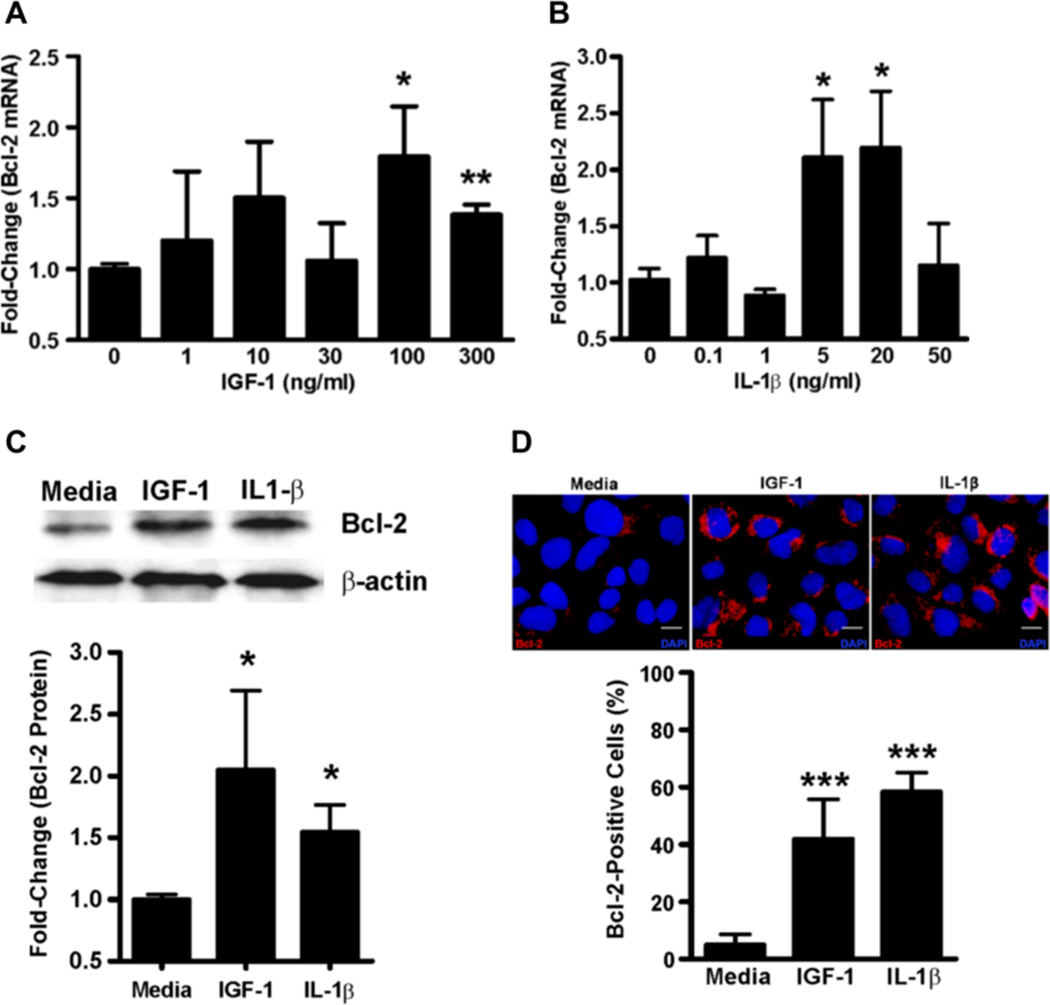
Bcl-2 mRNA levels in AALEB cells 24 h after treatment with rhIGF-1 (A) or rhIL-1β (B) as quantified by qRT-PCR. (C) Bcl-2 protein levels in AALEBs following treatment with IGF-1 (100 ng/ml) and IL-1β (5 ng/ml) compared to the non-treated cells and normalized to the β-actin levels (n=3). The upper panel shows a representative immunoblot. (D) In-situ analysis of Bcl-2 expression in AALEB cells by immunofluorescence following IGF-1 (100 ng/ml) and IL-1β (5 ng/ml) treatment. The Bcl-2-positive and total cells were counted 24 h after treatment and data expressed as the percent of Bcl-2 positive cells (n=3), results shown as mean ± SEM. * p<0.05, ** p<0.01, *** p<0.001. Scale bars, 10 µm.